01 _ overview _ barwon south western

map of regional victoria

barwon south western region
Region overview.
The Barwon South West region stretches from the tip of the Queenscliff Heads to the border of South Australia. It has a population of approximately 420,000 people and includes some of Victoria’s fastest-growing municipalities. The region comprises two sub-regions: G21 and Great South Coast (GSC). Both sub-regions have established alliances of regional stakeholders to complete extensive consultative plans and projects. The Barwon South West has three economies: one inland which is founded on agriculture; one on the coast that is dominated by tourism and amenity lifestyles; and one in Geelong which has a diverse economic and social base.

The Barwon South West main industries are manufacturing, retail trade, health care, construction, education and training, agriculture, forestry, fishing, and tourism. Our key infrastructure assets include deep seaports, road and rail freight networks, and Avalon Airport. The region has higher than average rainfall and wind, providing ongoing competitive strengths in agriculture, food, and new energy production. The coastline includes marine national parks, surf beaches, and the iconic Great Ocean Road.

420,822
ABS Estimated Resident Population 2019*
The population estimate for Barwon South West Region as of the 30th June 2019 is 420,822. Since the previous year, the population has grown by 1.98%. Population growth in Regional VIC was 1.37%.
Percentage change in Estimated Resident Population - Barwon South West Region compared to Regional VIC.

total population: 360,384 *map info souce: https://map.aurin.orng.au*

02 _ population _ barwon south western
source: Australian Bureau of Statistics, Regional Population Growth, Australia (3218.0). Compiled and presented by. id the population.
BARWON SOUTH WESTERN POPULATION
03 _ demographics _ barwon south western
2016
selected subpopulation categories.
Barwon South West Region - Total people (Usual residence)
Indigenous background.
The original inhabitants of the Barwon South West Region were the Bunganditj, Coladjin, Djab Wurrung, Djargurd Wurrung, Gadubanud, Girai Wurrung, Gulidjan, Gunditjmara, Jardwadjali, Tjap Wurrung and Wathaurong (Wadawurrung) Aboriginal people.

source: Australian Bureau of Statistics, Census of Population and Housing 2016. Compiled and presented in profile.id.
04 _ indigenous profile _ barwon south western


4,475
With an Aboriginal population of 4,475, the Barwon South West region accounts for approximately 9% of Victoria’s total Aboriginal population.
9% of Victoria’s total aboriginal population.

* % out of total indigenous population of Barwon South Western

Developmentally Vulnerable
of Indigenous children were likely to die during early childhood as non-indigenous children.
458.000 hospitalisations fr Indigenous Australias; this equates to a rate that is 1.3 times the rate for non-indigenous Australians.
05 _ healthcare _ barwon south western


1. Multicultural Aged Care Services
2. Hospice Foundation Geelong
3. Anam Cara Geelong
4. St. John of God Geelong Hospital
5. Epworth Geelong
6. Barwon Health
7. Torquay Maternal
8. Moriac Maternal & Child Centre
9. Maternal & Child Health Centre
10. Allay Occupational Therapy
11. SkyHi Occupational Therapy
12. Geelong and Surrounds Occupational Therapy
BARWON SOUTH WESTERN HEALTHCARE
06 _ socio-economic map _ barwon south western
GRP (Gross Regional Product)

Local Jobs
18,065
National Institute of Economic and industry (2019)
$1.77billion
National Institute of Economic and industry (2019)
Local Businesses
2,841
Australia Bureau of Statistics
Largest Industry (by employment)
Health Care and Social Assistance
Census 2019
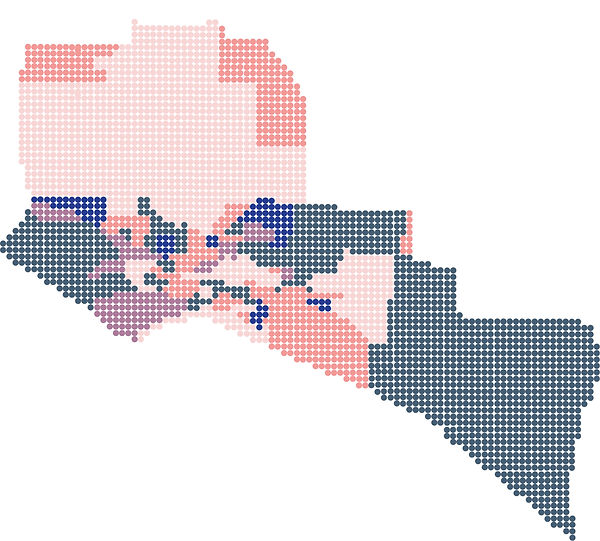
INDEX OF RELATIVE SOCIO-ECONOMIC ADVANTAGE AND DISADVANTAGE (IRSAD)

TOP INDUSTRIES

Hospitals (Except Psychiatric Hospitals)
Cheese and Other Dairy Product Manufacturing
Supermarket and Grocery Stores
Takeaway Food Services
Aged Care Residential Services
07 _ transportation map _ barwon south western

ROUTES TO BARWON SOUTH WESTERN
METHODS OF TRANSPORT

08 _ science of deduction

Bushfire:
Bushfire overlap map: From this map, we were able to narrow down our choice of the site as we were avoiding areas that have a high risk of bushfires. As a result; Glenelg, Colac-Otway and Southern Grampians were ruled out.
BUSHFIRE MAP

HEALTHCARE LOCATION MAP
Health:
The healthcare map gives an indication of the facilities available in each LGA. Geelong and Surf Coast were considered to have access to facilities in Melbourne due to the distance. Since a hospice requires an area with good access to other health care services; Warrnambool was evaluated as the top selection for a hospice proposal with its relatively higher health care facilities.
09 _ blackout map

Blackout Map:
The blackout map visualizes how we eliminated different religions because of the data we gathered. By using related information such as bushfire map, heritage overlay, ocean sea rise, and contours, we were able to eliminate and narrow down the number of options for a site. Eventually, the map allowed us to narrow down the choices into 2 local government areas; Moyne and Warrnambool.


* Australia bushfire

* Ocean sea rise/flooding

* Heritage buildings
10 _ warrnambool map


* Aerial photoshoot
* Granny’s Grave Beach &Hopkins River Bridge

* Warrnambool suburb panorama
11 _ healthcare at warrnambool

1. Western District Radiology
2. South West Diabetes Care
3. South West Healthcare Oncology
4. Warrnambool Radiology
5. Women's Health and Well being Barwon
6. Solutions Skins Health Clinic
7. Great Places Psychology
8. Warrnambool Eye Specialists
9. Child Development Spot
10. Maternal & Child Health
WARRNAMBOOL HEALTH FACILITIES

12 _ local services at warrnambool

In the search for collaboration:
One of the core elements of building a hospice is community. This diagram allows us to explore amenities and services that might be available for us to collaborate with different communities surrounding the area.
13 _ local government area comparison
MOYNE

WARRNAMBOOL
PEOPLE
ABORIGINAL AND/OR TORRES STRAIT ISLANDER PEOPLE
AGE (0-19)
CANCER INCIDENCE

PEOPLE
ABORIGINAL AND/OR TORRES STRAIT ISLANDER PEOPLE
AGE (0-19)
CANCER INCIDENCE
14 _ population at warrnambool
WARRNAMBOOL POPULATION MAP

12,076
ha (121 Km2)
Land area
35,181
Australian Bureau of Statistics Estimated Resident Population 2019*
2.91
person per hectare
Population Density
